Business & Commerce
Creative & Performing Arts
Humanities & Language
Science


Creative & Performing Arts
Humanities & Language
Science
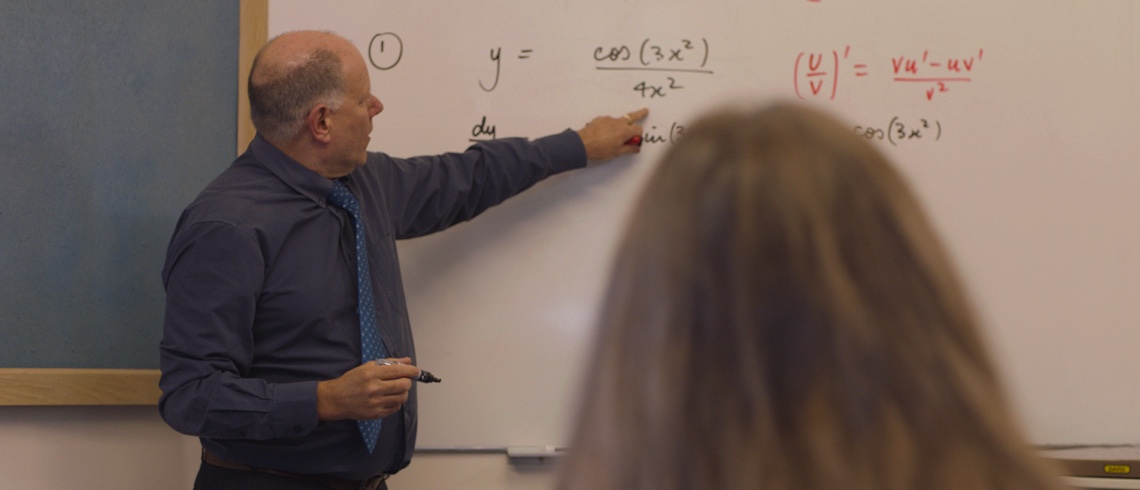
MATHS

In everyday, practical lives mathematics is indispensable.
Mathematics is the oldest of the sciences and those who choose to study it as an A-level subject like its challenge and its clarity. The ability to describe many different, seemingly complex, problems with mathematical models is incredibly powerful and valuable insights can be deduced from their use. Mathematics is all about logical analysis, deduction and calculation and its great importance lies in the fact that it can take the patterns it finds and use them to explain and control natural happenings and situations.
It all
adds up